Epsom & Ewell is the most densely populated borough in Surrey, with a population density of 2,375 residents per square km. The average population density in surrey is 724, so Epsom & Ewell is more than three times the average.
The population growth rate in Epsom & Ewell, is one of the highest between 2011 and 2021, with a growth rate of 7.8%. The numbers below are from information in the census for 2001, 2011, 2021. Provided by Surrey County Council, Data London and Wikipedia.
#surrey #planning #epsom #ewell #epsomandewell
Settlement Population
There are 37 settlements in Surrey listed on Wikipedia. The largest settlements and those located close to Ewell and Epsom are listed below. Epsom has the highest growth rate in the 10 year period.
Rank Settlement 2001 2011
1 Woking 96,420 105,367 (9% growth)
2 Guildford 70,000 77,057
3 Walton-on-Thames 62,540 66,566
4 Ewell 49,180 51,727
5 Esher 47,340 50,904
7 Redhill 29,590 34,498 (17% growth)
8 Leatherhead 30,150 32,522
9 Epsom 26,260 31,474 (20% growth)
10 Weybridge 26,863 29,837
17 Reigate 20,826 22,123
20 Cobham 16,360 17,273
23 Ashtead 13,210 13,901
27 Banstead 10,120 10,653
Epsom and Ewell Population
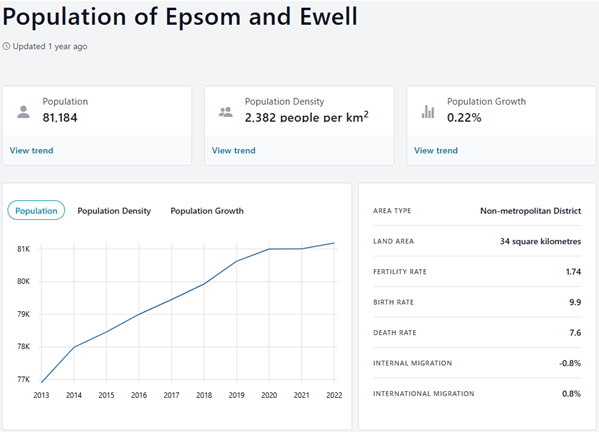
The population of Epsom and Ewell is 81,184 according to mid-2022 population figures published by the ONS. In the year between mid-2021 and mid-2022, the population in Epsom and Ewell grew by an estimated 178 people, and in the ten years prior to mid-2022, the population grew by 4,278. If the population continues to grow at current rate, the 2024 population estimate would be 82,000.
Epsom and Ewell’s population growth rate between mid-2021 and mid-2022 was 0.2%, which is 0.4% lower than the average population growth rate in Epsom and Ewell for the ten years prior to mid-2022 (0.6%).
Epsom and Ewell covers an area of 34 square kilometres (13 square miles) and has a population density of 2,382 people per square kilometre (km2), based on the latest population estimates taken in mid-2022. That figure has increased by 126 people per km2 over the past decade.
Compared to England’s figures
- Epsom and Ewell’s population of 81,184 is equivalent to 0.1% of England’s 57,106,398 total population. Epsom and Ewell is the 150th non-metropolitan district in England (of 164 total) when ordered by total population.
- Epsom and Ewell’s population density of 2,382 people per km2 is 1,944 people per km2 higher than England’s 438 people per km2. Epsom and Ewell is the 20th Non-metropolitan District in England (of 164 total) when ordered by population density.
For more information, please click on the link below.
Epsom and Ewell Population | Varbes
Population by Area/Council in Surrey
The usually resident population of Surrey, counted by the 2021 Census, was 1,203,108, a 6.2% increase on 2011 Census. This growth rate is lightly lower than England as a whole (6.6%).
All borough / district councils exhibited population growth varying from 2.4% (Mole Valley) to 9.4% (Reigate and Banstead).
Population density across Surrey is 724 usual residents per square kilometre. This varies between borough / district councils from a low of 338 (Mole Valley) to a high of 2,375 (Epsom and Ewell).
Total population has grown faster than the number of households, so average household size has increased. Across Surrey there were 481,818 households – a growth of 5.7% relative to the 2011 Census.
Area Name Persons 2021 Persons 2011 Change % Change
England 56,490,048 53,012,456 3,477,592 6.6%
South East 9,278,065 8,634,750 643,315 7.5%
Surrey 1,203,108 1,132,390 70,718 6.2%
Elmbridge 138,754 130,875 7,879 6.0%
Epsom and Ewell 80,938 75,102 5,836 7.8%
Guildford 143,649 137,183 6,466 4.7%
Mole Valley 87,386 85,375 2,011 2.4%
Reigate and Banstead 150,846 137,835 13,011 9.4%
Runnymede 88,079 80,510 7,569 9.4%
Spelthorne 102,956 95,598 7,358 7 .7%
Surrey Heath 90,453 86,144 4,309 5.0%
Tandridge 87,874 82,998 4,876 5.9%
Waverley 128,229 121,572 6,657 5.5%
Woking 103,943 99,198 4,745 4.8%
Merton 215,187 199,693 15,494 7.8%
Sutton 209,639 190,146 19,493 10.2%
Kingston 168,063 160,060 8,003 5%
Households
The average number of persons per household are similar
Area Name Residents 2021 Households People Average
Surrey 1,203,111 481,818 2.50
Elmbridge 138,757 55,590 2.50
Epsom and Ewell 80,939 31,321 2.58
Guildford 143,646 55,760 2.58
Mole Valley 87,386 37,139 2.35
Reigate and Banstead 150,852 59,849 2.52
Runnymede 88,085 34,838 2.53
Spelthorne 102,953 41,805 2.46
Surrey Heath 90,460 36,008 2.51
Tandridge 87,878 35,623 2.47
Waverley 128,231 52,448 2.44
Woking 103,940 41,437 2.51
Figures from Figures Data London show the Designated Green Belt per borough.
Merton has no Green Belt land
Sutton reduced from 620 in 2007, to 600 in 2023 (3.2% reduction)
Kingston has 640, with no change between 2007 and 2023
