The information below is from Wikipedia (Metropolitan Green Belt). The details are for the size of each borough and the size of the green belt land. The details are for all boroughs in Surrey and some from Greater London.
#greenbelt #planning #surrey #epsom #ewell
Name Area (ha) Greenbelt (ha) Greenbelt %
Elmbridge 9,630 5,620 58%
Epsom and Ewell 3,407 1,560 46%
Guildford 27,100 24,040 89%
Reigate and Banstead 12,910 8,890 69%
Runnymede 7,800 6,140 79%
Spelthorne 5,116 3,320 65%
Surrey Heath 9,510 4,190 44%
Tandridge 24,820 23,300 94%
Waverley 34,520 21,080 61%
Woking 6,360 4,030 63%
Kingston upon Thames 3,725 640 17%
Richmond upon Thames 5,741 140 2%
Sutton 4,385 620 14%
Epsom and Ewell is by far the smallest borough in Surrey. Surrey Heath has the lowest percentage of green belt in Surrey, followed closely by Epsom and Ewell. The details below compares the size and population of the two boroughs. Surrey Heath includes Frimley, Camberley and Bagshot.
Surrey Heath has almost three times the area of Epsom and Ewell, but the population is just over 12% higher. The density of population in Epsom and Ewell is 2.5 times higher! The growth in population in Epsom and Ewell is 1.5 times higher than Surrey Heath, so pressure and land will continue to grow, unless growth targets are significantly reduced.
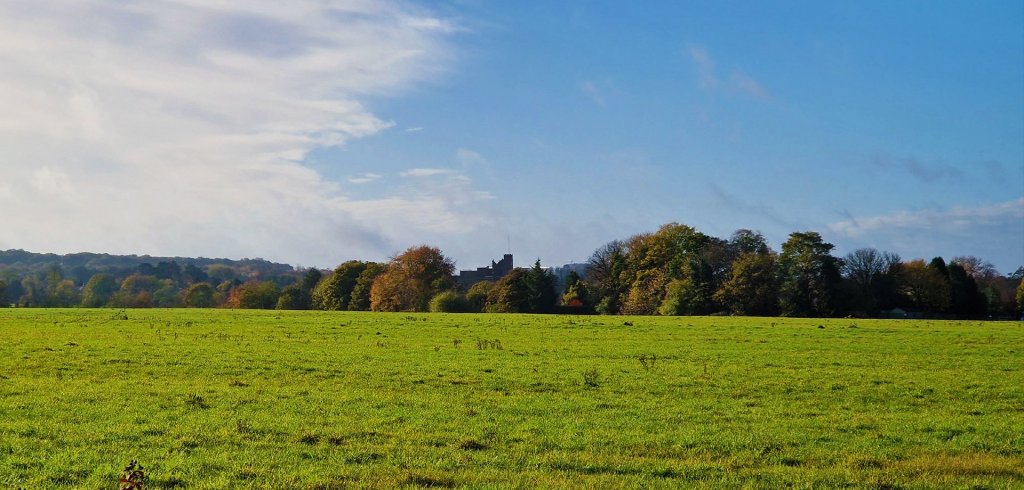
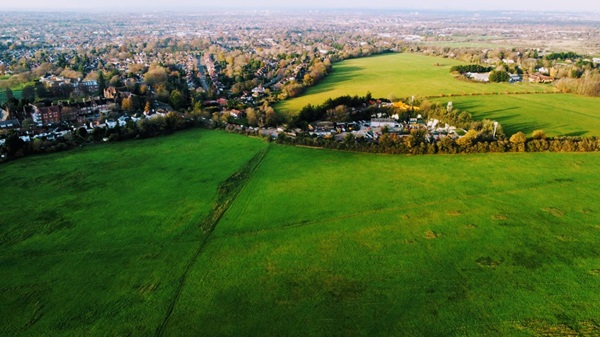
The green spaces in and around Epsom and Ewell are much needed due to the high density of the population.
Surrey Heath
Area
• Total 36.7 sq mi (95.1 km2)
Population (2022)
• Total 91,237
• Density 2,500/sq mi (960/km2)
Epsom and Ewell
Area
• Total 13.15 sq mi (34.07 km2)
Population (2022)
• Total 81,184
• Density 6,200/sq mi (2,400/km2)