
COUD_030 – Sustainability Appraisal (SA) of Epsom and Ewell Local Plan SA Report Addendum
This report assesses ways of adding more houses for Epsom and Ewell that were not included in the Local Plan submitted to UK Government. Urban and Green Belt sites have been considered and assessed, but there are many questions on the details of homes can be built on the sites, and the infrastructure needed to support the new homes and the new residents.
The housing targets set for Epsom and Ewell by UK Government do not take into account the small size of the borough and the high density of population, much higher than any other borough in Surrey.
The extracts below are from the 43 page Sustainability Appraisal report. The full report can be downloaded from the web link below. Feedback must be submitted by 15th June.
Localplan Additional Documents
2.2 The Submission Local Plan
2.2.1 Section 3 of the Submission Local Plan explained that:
- The plan period is 2022 to 2040.
- Local Housing Need (LHN) over this period is 10,242 homes on the basis of the 2023 version of the Government’s standard method, which provides a figure of 569 dwellings per annum (dpa).
- The proposed housing requirement is 4,700 homes in light of LHN and wider factors including the London Green Belt as a constraint to growth and wider suitability issues with available supply options.
- The identified housing land supply is 4,914 homes, i.e. such that there is a modest supply ‘headroom’ over-and-above the housing requirement with a view to ensuring that the housing requirement can be
delivered in practice, which is particularly important for the earlier years of the plan period (Figure 2.1). - The identified housing land supply in the Submission Local Plan comprises: completions (2022/23 to 2023/2024) = 456 homes; permissions = 600 homes; a windfall assumption = 862 homes; urban
allocations = 1,416 homes; and Green Belt allocations (2 x brownfield and 3 x greenfield) = 1,580 homes.
2.2.2 The implication of a housing requirement set below LHN is unmet housing need, which must then ideally be provided for by one or more neighbouring local authorities. However, in practice there is no established
potential for any unmet need generated by the Epsom and Ewell Local Plan to be provided for elsewhere.
2.2.3 The Council sought to justify unmet need (10,242 – 4,700 = 5,542 homes) on the basis of detailed work prior to submission, including consultation on a Draft Local Plan in 2023 and consideration of reasonable
alternative ‘growth scenarios’ through the SA process. However, in light of representations made to the examination the Inspector has now given a clear direction on the need to boost the housing requirement.
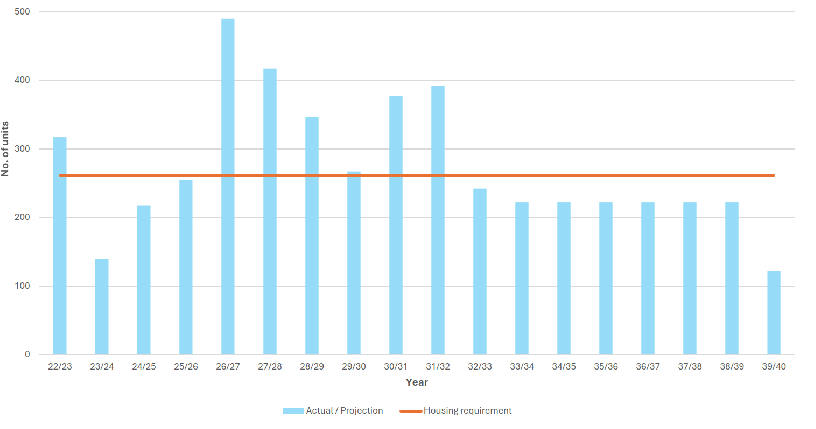
Figure 2.1: The housing trajectory as presented in the Submission Local Plan (2025)
Green Belt sites
2.3.5 The post hearings letter explained the following in respect of the submitted Green Belt Topic Paper:
“During the Matter 4 hearing session, it became clear that there are a number of shortcomings… These shortcomings relate to the assessment of the individual sites for release in relation to the criteria the Council have identified. Specifically, a number of the conclusions drawn are inconsistent with the evidence presented, the extent to which mitigation measures have and have not been taken into account in relation to individual sites is neither clear or consistent, there are errors in the way individual sites have been assessed and I also have concerns regarding the consistency of approach to the individual site assessments contained within the document. As a result, I am unable to conclude at this stage whether the Council have done enough through this exercise to address the acute housing needs of the borough.
In order to address this, we agreed that the Council should revisit this part of the evidence base to ensure that all of the sites contained within the report have been assessed in a consistent manner, in accordance with the methodology identified within the evidence.”
2.3.6 In response the Council prepared a Green Belt Topic Paper Updated (COUD_021) which presents a consistent proforma assessment of the complete long-list of Green Belt options that are potentially in contention for removal from the Green Belt through the Local Plan. Specifically, this comprises:
- 7 existing major developed sites.2
- 5 sites that are proposed allocations within the Submission Local Plan (2 x brownfield and 3 x greenfield), which are sites proposed to be removed from the Green Belt to deliver 1,580 homes.
- 21 sites not proposed for allocation within the Submission Local Plan (‘omission sites’), i.e. where the proposal at the time of submission was that these sites should remain in the Green Belt.
Urban sites
5.3.3 For context, the Submission Local Plan allocates urban sites for a total of 1,146 homes, but following the Stage 2 hearings in October 2026 understanding is that this figure will be adjusted to 1,440 homes. It is
clearly the case that this supply can be assumed as a ‘constant’ across the reasonable growth scenarios.
5.3.4 Focusing on the 13 additional sites for potential allocation identified in examination document COUD_020 (Feb 2026), which has been introduced above, the first point to note is that one site is now ruled out on flood risk grounds on the advice of the Lead Local Flood Authority, namely 47 Cheam Road (5 homes).
5.3.5 The capacity of the remaining 12 sites is 188 homes, and there is a clear case for holding this level of supply from additional urban allocations ‘constant’ across the reasonable growth scenarios, i.e. there is no clear case for testing lower or higher growth scenarios (recalling that no other sites are known to be available, and because there is no clear case for testing varying density assumptions).
Green Belt sites
5.3.6 As discussed in Section 2, the Green Belt Topic Paper Update (2026) discusses a long list of 33 Green Belt sites, but 7 of these can be immediately discounted as they are existing major developed sites.
5.3.7 Of the remaining 26 sites, the first point to note is that five of these are allocations within the Submission Local Plan, and indications following the Stage 2 hearings in October 2026 are that all five sites should e taken forward. Total supply from these five sites in the Submission Local Plan is 1,580 homes, but during the Stage 2 hearings it was agreed to increase the capacity of one site (SA32, Land at West Park Hospital (North)) from 150 to 180 homes, such that the total figure increases to 1,610 homes.
The table below presents the summary analysis from the Topic Paper in respect of these five sites.
5.3.9 Notes on the table are as follows:
- Sites are discussed in order of performance against the Calverton tests and then Green Belt sensitivity.
- The percentage of each site that is previously developed land (PDL) is recorded, and it should be noted that sites comprising a significant proportion of PDL are judged to automatically pass the Calverton tests.
- The transport score is that assigned by a study completed in 2023 (examination document IS06) where a higher score indicates strong performance (the highest score assigned to any site was 25.5).
- The Green Belt (GB) parcel sensitivity score is the overall score assigned to the relevant Green Belt parcel by the Green Belt Study Update 2024 (examination document GB01), where a higher score indicates higher sensitivity (the highest score assigned to any parcel was 9).
- The Calverton tests are introduced above in Section 2.
5.4.3 The following reasonable growth scenarios are defined:
- Growth Scenario 1 – the Submission Local Plan supply plus the 12 additional urban allocation options.
- Growth Scenario 2 – Scenario 1 plus additional allocation of three smaller Green Belt sites that are considered to generate relatively few concerns, namely HOR001, HOR004 and COL017.
- Growth Scenario 3 – Scenario 2 plus additional allocation of NON013 (Land at Priest Hill). This is a strongly performing site but as a larger site warrants being a variable across the growth scenarios.
- Growth Scenario 4 – Scenario 3 plus additional allocation of NON016 (Downs Farm). This site passes the Calverton test and could deliver a major boost to supply.
- Growth Scenario 5 – Scenario 4 plus additional allocation of HOR007 (Noble Park). This site passes the Calverton tests but is subject to suitability issues including in biodiversity terms.
- Growth Scenario 6 – Scenario 5 plus additional allocation of three sites that fail the Calverton tests but nonetheless warrant further consideration on balance (HOR002, COL019 and COL023).
5.4.4 Under the highest growth scenario (Scenario 6) total supply would be 6,529 which compares to the LHN figure of 10,242, i.e. such that there would be at least 3,713 homes unmet need. However, there are not considered to be any reasonable higher growth scenarios given the available supply options.
5.4.5 As a final point, it can be noted that all of the additional allocation options that feature across the reasonable growth scenarios at this stage also featured within the reasonable growth scenarios prior to Submission. This is the outcome of the evidence-led process reported in Sections 5.2 and 5.3.
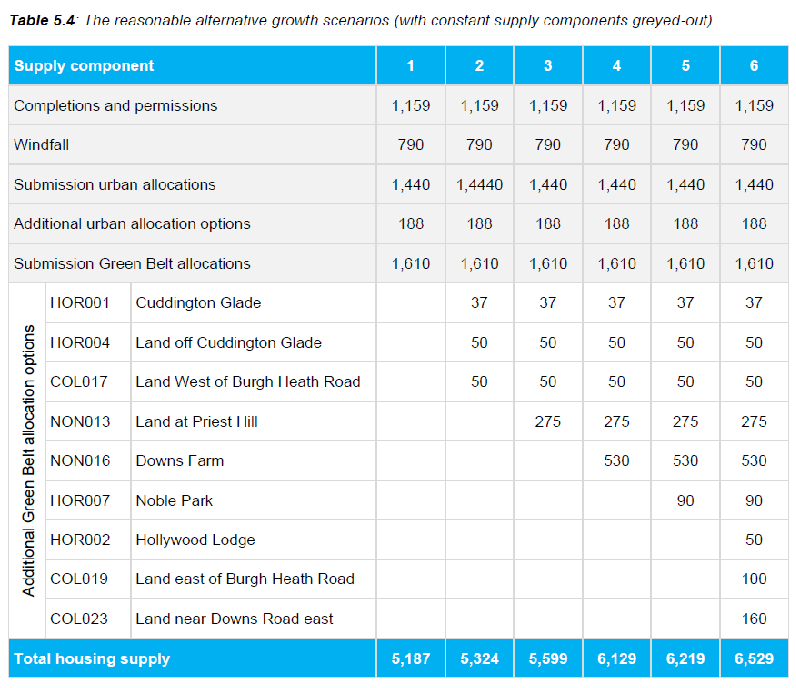
Table 5.4: The reasonable alternative growth scenarios (with constant supply components greyed-out)
